Scripts to prepare input & process output
Here is a list of scripts that can be used for BTV tasks.
fetch.py: create input json
Use fetch.py in folder scripts/ to obtain your samples json files. You can create $input_list ,which can be a list of datasets taken from CMS DAS or names of dataset(need to specify campaigns explicity), and create the json contains dataset_name:[filelist]. One can specify the local path in that input list for samples not published in CMS DAS. $output_json_name$ is the name of your output samples json file.
The --whitelist_sites, --blacklist_sites are considered for fetch dataset if multiple sites are available.
dump_prescale.py: Get Prescale weights
Caution
Only works if /cvmfs is binding in the system
Generate prescale weights using brilcalc
python scripts/dump_prescale.py --HLT $HLT --lumi $LUMIMASK
# HLT : put prescaled triggers
# lumi: golden lumi json
dump_processed.py Get processed information
Get the run & luminosity information for the processed events from the coffea output files. When you use --skipbadfiles, the submission will ignore files not accesible(or time out) by xrootd. This script helps you to dump the processed luminosity into a json file which can be calculated by brilcalc tool and provide a list of failed lumi sections by comparing the original json input to the one from the .coffea files.
# all is default, dump lumi and failed files, if run -t lumi only case. no json file need to be specified
python scripts/dump_processed.py -c $COFFEA_FILES -n $OUTPUT_NAME (-j $ORIGINAL_JSON -t [all,lumi,failed])
make_template.py: Store histograms from coffea file
Use scripts/make_template.py to dump 1D/2D histogram from .coffea to TH1D/TH2D with hist. MC histograms can be reweighted to according to luminosity value given via --lumi. You can also merge several files
python scripts/make_template.py -i "testfile/*.coffea" --lumi 7650 -o test.root -v mujet_pt -a '{"flav":0,"osss":"sum"}'
  -i INPUT, --input INPUT
                        Input coffea file(s)
  -v VARIABLE, --variable VARIABLE
                        Variables to store (histogram name)
  -a AXIS, --axis AXIS  dict, put the slicing of histogram, specify 'sum' option as string
  --lumi LUMI           Luminosity in /pb
  -o OUTPUT, --output OUTPUT
                        output root file name
  --mergemap MERGEMAP   Specify mergemap as dict, '{merge1:[dataset1,dataset2]...}' Also works with the json file with dict
Plotting code
Data/MC comparisons
Obtain the data MC comparisons from the input coffea files by normalized MC to corresponding luminosity. You can specify -v all to plot all the variables in the coffea file, or use wildcard options (e.g. -v "*DeepJet*" for the input variables containing DeepJet). Individual variables can be also specify by splitting with ,.
python scripts/plotdataMC.py -i $COFFEA --lumi $LUMI_IN_invPB -p $WORKFLOW -v $VARIABLE --autorebin $REBIN_OPTION --split $SPLIT_OPTION
python scripts/plotdataMC.py -i a.coffea,b.coffea --lumi 41500 -p ttdilep_sf -v z_mass,z_pt
python scripts/plotdataMC.py -i "test*.coffea" --lumi 41500 -p ttdilep_sf -v z_mass,z_pt # with wildcard option need ""
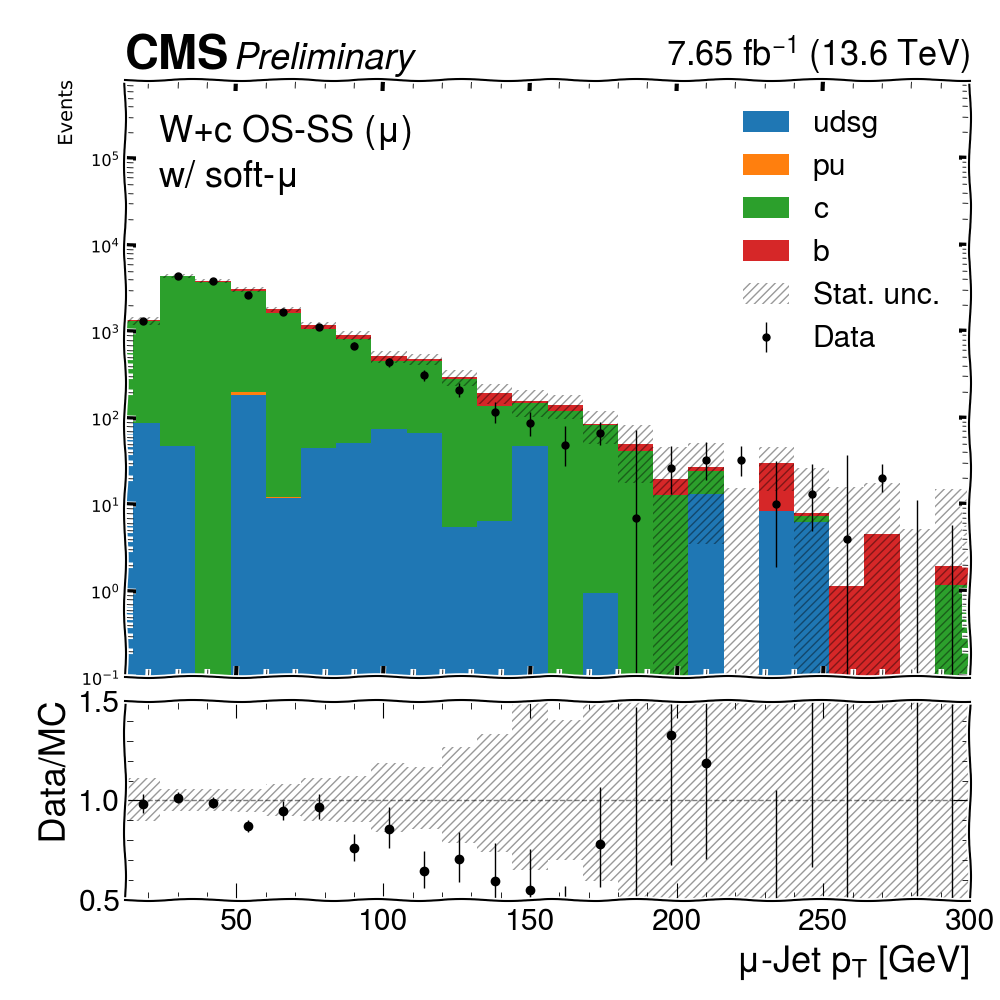
There are a few options supply for the splitting scheme based on jet flavor or sample.

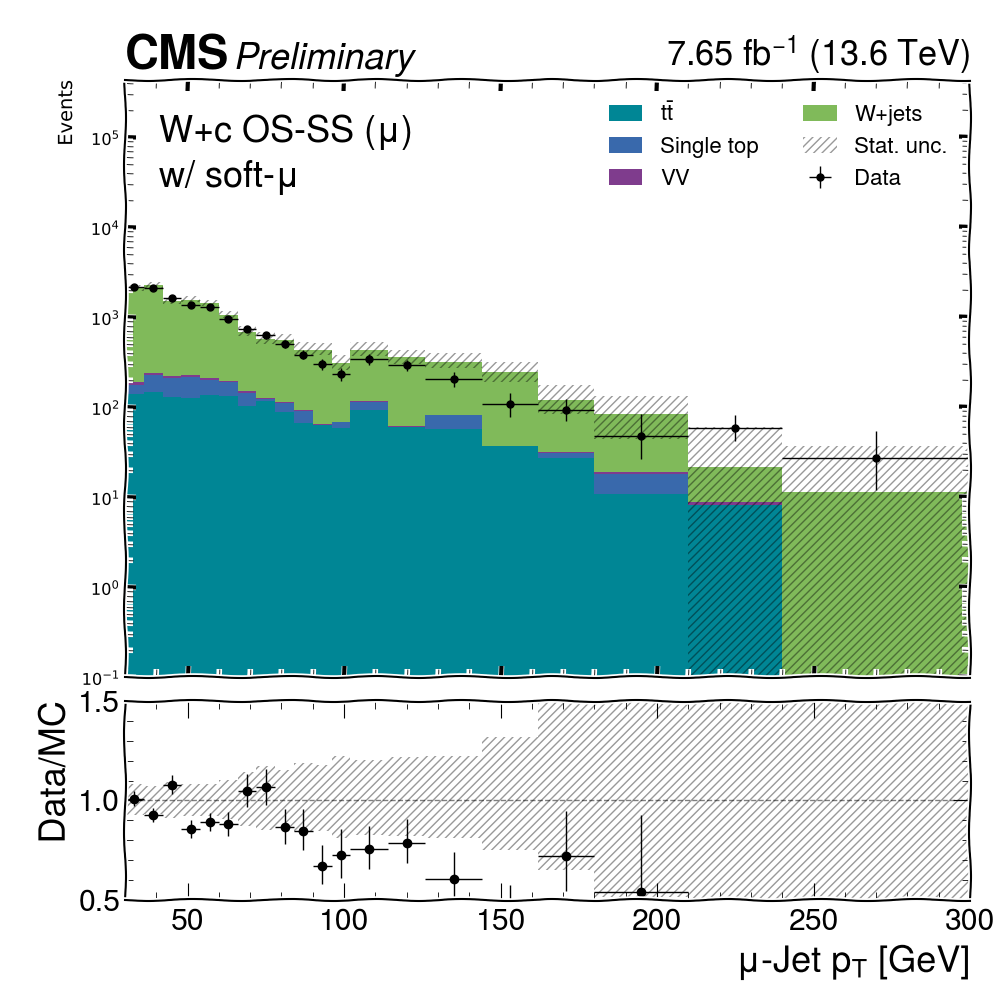
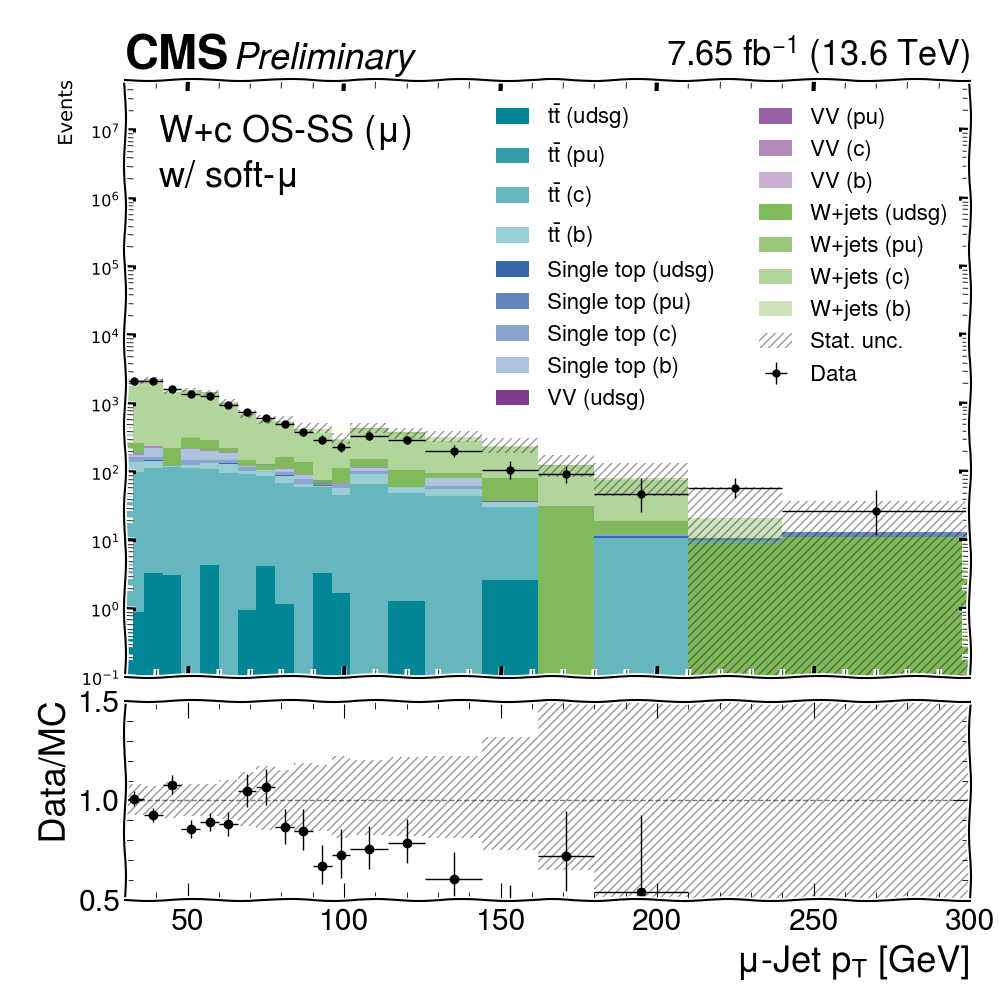
It also supports rebinning. Integer input refers the the rebinning through merging bins --rebin 2. It also supports non-uniform rebinning, specify the bins with a list of edges --autorebin 30,36,42,48,54,60,66,72,78,84,90,96,102,114,126,144,162,180,210,240,300
options:
  --lumi LUMI           luminosity in /pb
  --com COM             sqrt(s) in TeV
  -p {ttdilep_sf,ttsemilep_sf,ctag_Wc_sf,ctag_DY_sf,ctag_ttsemilep_sf,ctag_ttdilep_sf}, --phase {dilep_sf,ttsemilep_sf,ctag_Wc_sf,ctag_DY_sf,ctag_ttsemilep_sf,ctag_ttdilep_sf}
                        which phase space
  --log LOG             log on y axis
  --norm NORM           Use for reshape SF, scale to same yield as no SFs case
  -v VARIABLE, --variable VARIABLE
                        variables to plot, splitted by ,. Wildcard option * available as well. Specifying `all` will run through all variables.
  --SF                  make w/, w/o SF comparisons
  --ext EXT             prefix name
  -i INPUT, --input INPUT
                        input coffea files (str), splitted different files with ','. Wildcard option * available as well.
   --autorebin AUTOREBIN
                        Rebin the plotting variables, input `int` or `list`. int: merge N bins. list of number: rebin edges(non-uniform bin is possible)
   --xlabel XLABEL      rename the label for x-axis
   --ylabel YLABEL      rename the label for y-axis
   --splitOSSS SPLITOSSS
                        Only for W+c phase space, split opposite sign(1) and same sign events(-1), if not specified, the combined OS-SS phase space is used
   --xrange XRANGE      custom x-range, --xrange xmin,xmax
   --flow FLOW
                        str, optional {None, 'show', 'sum'} Whether plot the under/overflow bin. If 'show', add additional under/overflow bin. If 'sum', add the under/overflow bin content to first/last bin.
   --split {flavor,sample,sample_flav}
                        Decomposition of MC samples. Default is split to jet flavor(udsg, pu, c, b), possible to split by group of MC
                        samples. Combination of jetflavor+ sample split is also possible
Data/MC comparisons with full systematics
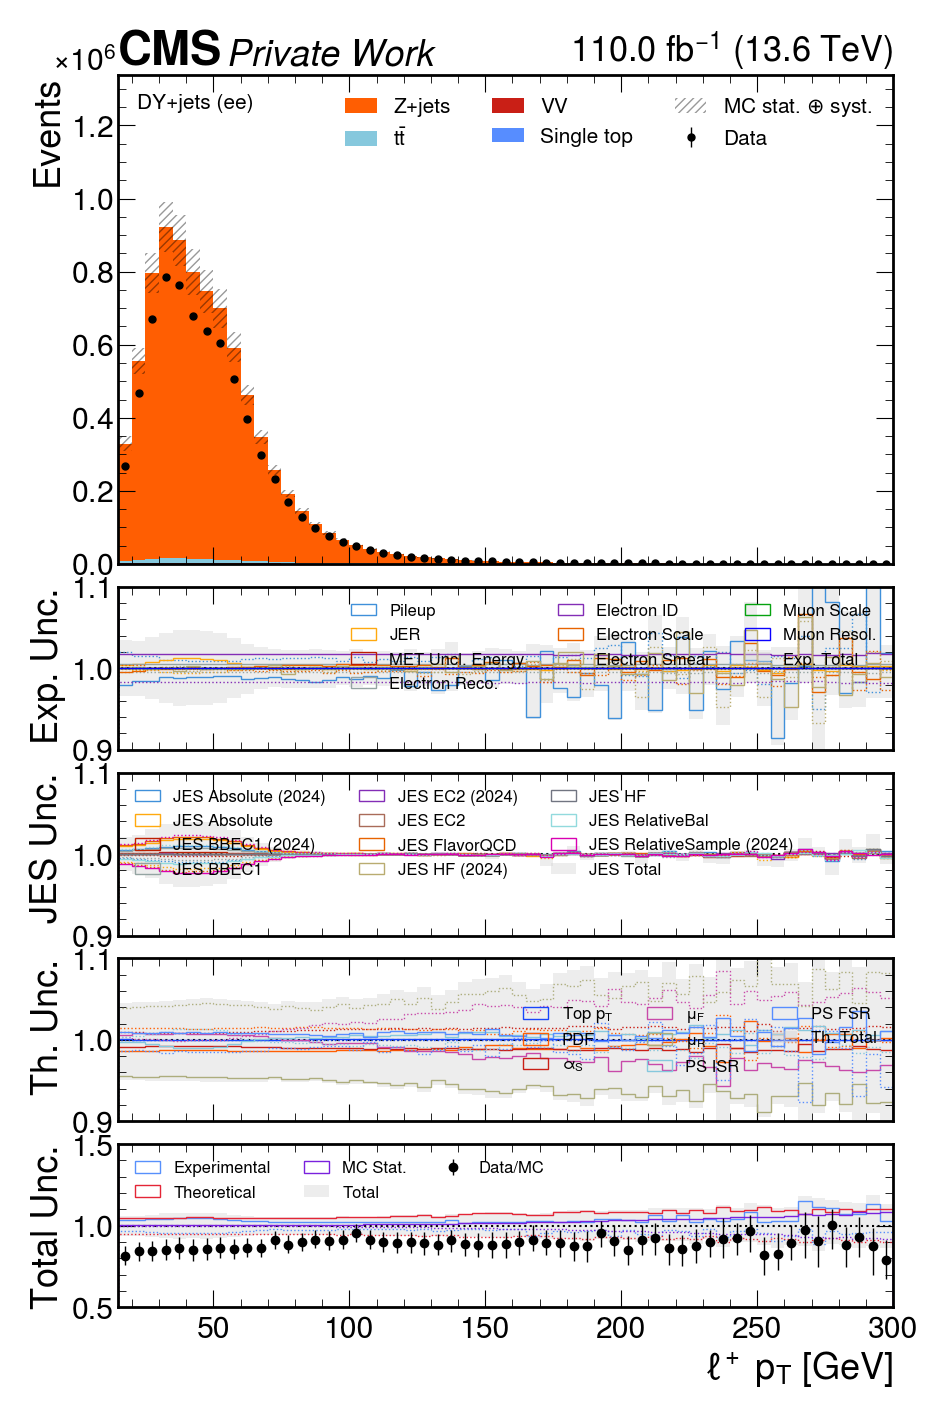
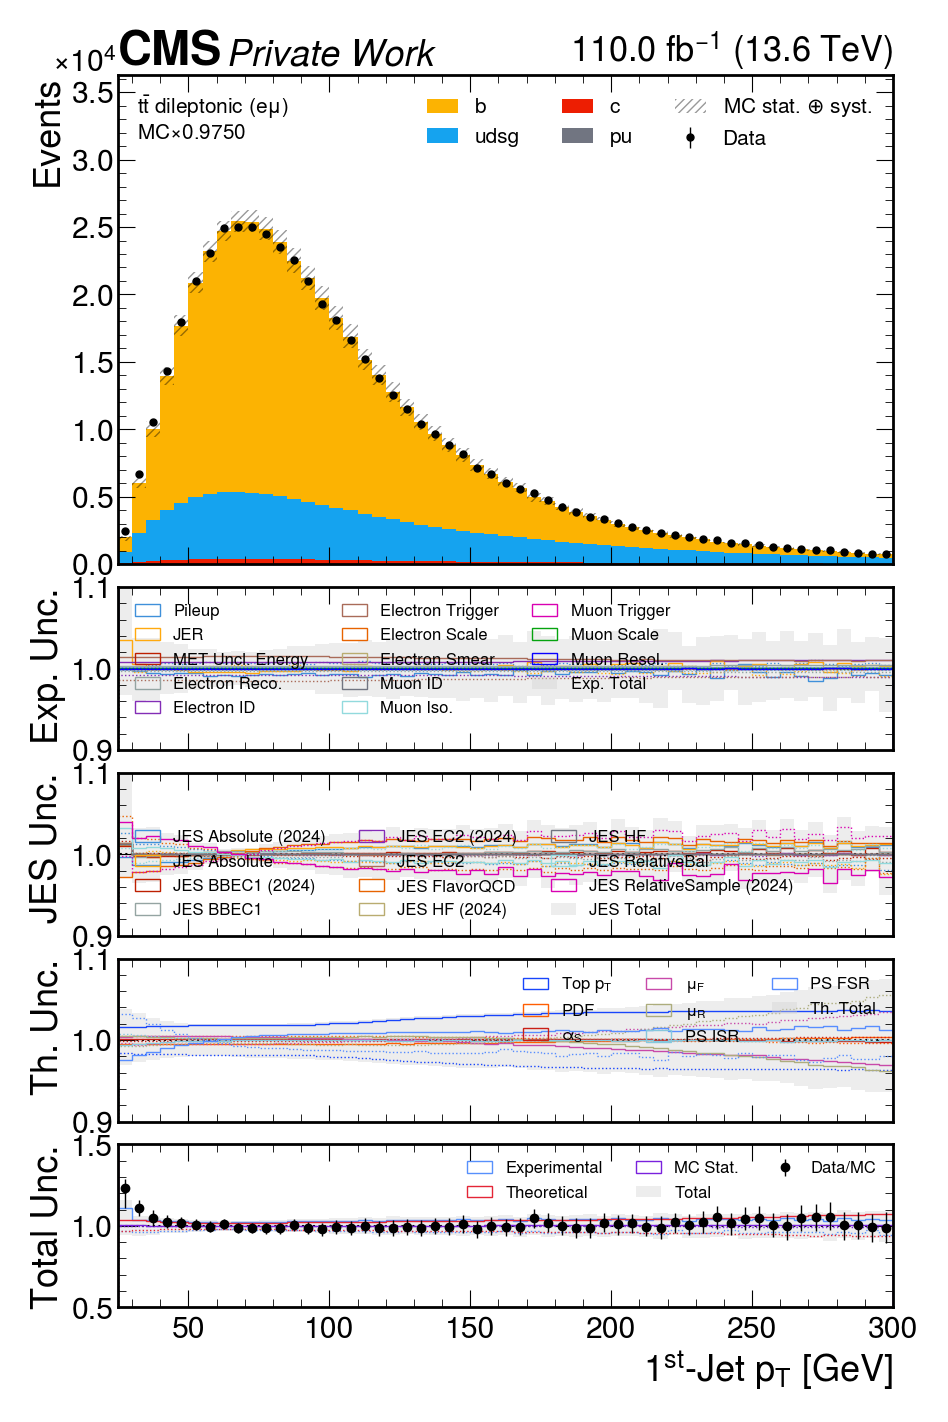
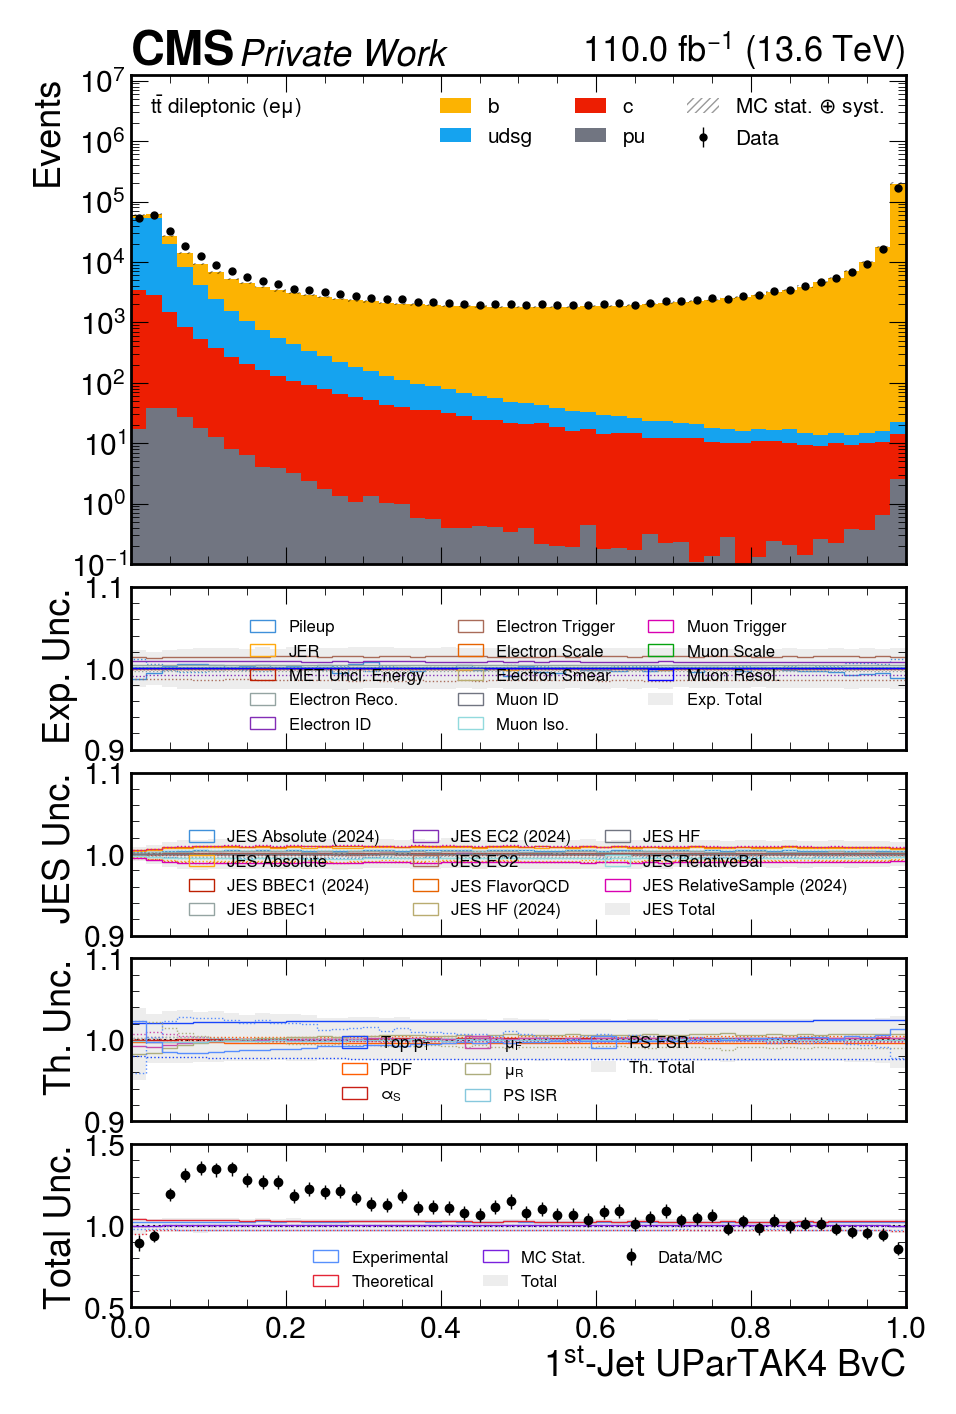
Obtain the data to MC comparisons with all systematics shown below. Individual variables must be specified, and split with ,.
Each run of plotSysts.py saves two versions of the plot: one with the proper MC normalization (e.g. with the correct luminosity and event weights), and one with MC normalized to data (to check for shape effects). One can also choose to save a third version of the plot with the y-axis in log scale via --log.
By default, the plots are split by sample. One can specify a flavour split instead via -s flavour.
python plotSysts.py -i $COFFEA --lumi $LUMI_IN_invPB -w $WORKFLOW --campaign $CAMPAIGN --log -e puweight -e JESRegrouped_Absolute_$CAMPAIGN -e JESRegrouped_Absolute -e JESRegrouped_BBEC1_$CAMPAIGN -e JESRegrouped_BBEC1 -e JESRegrouped_EC2_$CAMPAIGN -e JESRegrouped_EC2 -e JESRegrouped_FlavorQCD -e JESRegrouped_HF_$CAMPAIGN -e JESRegrouped_HF -e JESRegrouped_RelativeBal -e JESRegrouped_RelativeSample_$CAMPAIGN -e JEReta0to1p93 -e JEReta1p93to2p5 -e UES -e ele_Reco -e ele_ID -e ele_Trig -e ElectronScale -e ElectronSmear -e mu_ID -e mu_Iso -e mu_Trig -e MuonScale -e MuonResol -t ttbar_weight -t PDF_weight -t aS_weight -t scalevar_muF -t scalevar_muR -t UEPS_ISR -t UEPS_FSR -v $VAR1,$VAR2,$VAR3
python plotSysts.py -i $COFFEA --lumi $LUMI_IN_invPB -w $WORKFLOW --campaign $CAMPAIGN -e puweight -e JESRegrouped_Absolute_$CAMPAIGN -e JESRegrouped_Absolute -e JESRegrouped_BBEC1_$CAMPAIGN -e JESRegrouped_BBEC1 -e JESRegrouped_EC2_$CAMPAIGN -e JESRegrouped_EC2 -e JESRegrouped_FlavorQCD -e JESRegrouped_HF_$CAMPAIGN -e JESRegrouped_HF -e JESRegrouped_RelativeBal -e JESRegrouped_RelativeSample_$CAMPAIGN -e JEReta0to1p93 -e JEReta1p93to2p5 -e UES -e ele_Reco -e ele_ID -e ele_Trig -e ElectronScale -e ElectronSmear -e mu_ID -e mu_Iso -e mu_Trig -e MuonScale -e MuonResol -t ttbar_weight -t PDF_weight -t aS_weight -t scalevar_muF -t scalevar_muR -t UEPS_ISR -t UEPS_FSR -o plot -s flavour -v $VAR1,$VAR2,$VAR3
options:
  -i INPUT, --input INPUT
                        Input coffea file(s).
  -o OUTDIR, --outdir OUTDIR
                        Output directory.
  -v VARS, --vars VARS  Variable(s) to plot (histogram name), separated by commas.
  -w {2D_e_DY_sf,2D_mu_DY_sf,2D_e_Wc_sf,2D_mu_Wc_sf,2D_emu_ttdilep_sf,2D_e_ttsemilep_sf,2D_mu_ttsemilep_sf}, --workflow {2D_e_DY_sf,2D_mu_DY_sf,2D_e_Wc_sf,2D_mu_Wc_sf,2D_emu_ttdilep_sf,2D_e_ttsemilep_sf,2D_mu_ttsemilep_sf}
                        Workflow.
  --campaign {Run3,2425,Summer22,Summer22EE,Summer23,Summer23BPix,Summer24,Prompt25}
                        Campaign.
  -s {sample,flavour}, --split {sample,flavour}
                        Histogram stack splitting.
  --splitOSSS {None,1,-1}
                        Only for W+c phase space, split opposite sign (1) and same sign events (-1). If not specified, the combined OS-SS phase space is used.
  -e {puweight,JESRegrouped_Absolute_$CAMPAIGN,JESRegrouped_Absolute,JESRegrouped_BBEC1_$CAMPAIGN,JESRegrouped_BBEC1,JESRegrouped_EC2_$CAMPAIGN,JESRegrouped_EC2,JESRegrouped_FlavorQCD,JESRegrouped_HF_$CAMPAIGN,JESRegrouped_HF,JESRegrouped_RelativeBal,JESRegrouped_RelativeSample_$CAMPAIGN,JESTotal,JEReta0to1p93,JEReta1p93to2p5,JERTotal,UES,ele_Reco,ele_ID,ele_Trig,ElectronScale,ElectronSmear,mu_ID,mu_Iso,mu_Trig,MuonScale,MuonResol}, --exp_systs {puweight,JESRegrouped_Absolute_$CAMPAIGN,JESRegrouped_Absolute,JESRegrouped_BBEC1_$CAMPAIGN,JESRegrouped_BBEC1,JESRegrouped_EC2_$CAMPAIGN,JESRegrouped_EC2,JESRegrouped_FlavorQCD,JESRegrouped_HF_$CAMPAIGN,JESRegrouped_HF,JESRegrouped_RelativeBal,JESRegrouped_RelativeSample_$CAMPAIGN,JESTotal,JEReta0to1p93,JEReta1p93to2p5,JERTotal,UES,ele_Reco,ele_ID,ele_Trig,ElectronScale,ElectronSmear,mu_ID,mu_Iso,mu_Trig,MuonScale,MuonResol}
                        Experimental uncertainties to include in the plots.
  -t {ttbar_weight,PDF_weight,aS_weight,scalevar_muF,scalevar_muR,UEPS_ISR,UEPS_FSR}, --th_systs {ttbar_weight,PDF_weight,aS_weight,scalevar_muF,scalevar_muR,UEPS_ISR,UEPS_FSR}
                        Theory uncertainties to include in the plots.
  --lumi LUMI           Luminosity in /pb.
  --mergemap MERGEMAP   Specify mergemap as dict: `{merge1:[dataset1,dataset2]...}`. Also works with a json file containing a dict.
  --log                 Save an additional plot with log scale on y axis (default = False).
Data/data, MC/MC comparisons
You can specify -v all to plot all the variables in the coffea file, or use wildcard options (e.g. -v "*DeepJet*" for the input variables containing DeepJet)
# with merge map, compare ttbar with data
python scripts/comparison.py -i "*.coffea" --mergemap '{"ttbar": ["TTto2L2Nu_TuneCP5_13p6TeV_powheg-pythia8","TTto4Q_TuneCP5_13p6TeV_powheg-pythia8","TTtoLNu2Q_TuneCP5_13p6TeV_powheg-pythia8],"data":["MuonRun2022C-27Jun2023-v1","MuonRun2022D-27Jun2023-v1"]}' -r ttbar -c data -v mu_pt  -p ttdilep_sf
# if no  mergemap, take the key name directly
python scripts/comparison.py -i datac.coffea,datad.coffea -r MuonRun2022C-27Jun2023-v1 -c MuonRun2022D-27Jun2023-v1 -v mu_pt  -p ttdilep_sf
In #128, comparisons with same dataset name is possible, but require different configurations for mergemap
{
    # group the name of coffea file and key name later
    "fname": {
        "reference": "coffea file of reference"
        "comparison 1": "coffea file of comparison 1"
        "comparison 2": "coffea file of comparison 2"
    },
    "dataset": ["dataset name"] # list of dataset names,
    "ttbar": ["TTto2L2Nu_TuneCP5_13p6TeV_powheg-pythia8", "TTto4Q_TuneCP5_13p6TeV_powheg-pythia8"]
}
options:
  -h, --help            show this help message and exit
  -p {dilep_sf,ttsemilep_sf,ctag_Wc_sf,ctag_DY_sf,ctag_ttsemilep_sf,ctag_ttdilep_sf}, --phase {dilep_sf,ttsemilep_sf,ctag_Wc_sf,ctag_DY_sf,ctag_ttsemilep_sf,ctag_ttdilep_sf}
                        which phase space
  -i INPUT, --input INPUT
                        input coffea files (str), splitted different files with ','. Wildcard option * available as well.
  -r REF, --ref REF     referance dataset
  -c COMPARED, --compared COMPARED
                        compared datasets, splitted by ,
  --sepflav SEPFLAV     seperate flavour(b/c/light)
  --log                 log on y axis
  -v VARIABLE, --variable VARIABLE
                        variables to plot, splitted by ,. Wildcard option * available as well. Specifying `all` will run through all variables.
  --ext EXT             prefix name
  --com COM             sqrt(s) in TeV
  --mergemap MERGEMAP
                        Group list of sample(keys in coffea) as reference/compare set as dictionary format. Keys would be the new lables of the group. Now also accept .json file
   --autorebin AUTOREBIN
                        Rebin the plotting variables, input `int` or `list`. int: merge N bins. list of number: rebin edges(non-uniform bin is possible)
   --xlabel XLABEL      rename the label for x-axis
   --ylabel YLABEL      rename the label for y-axis
   --norm               compare shape, normalized yield to reference
   --xrange XRANGE       custom x-range, --xrange xmin,xmax
   --flow FLOW
                        str, optional {None, 'show', 'sum'} Whether plot the under/overflow bin. If 'show', add additional under/overflow bin. If 'sum', add the under/overflow bin content to first/last bin.
ROCs & efficiency plots
Extract the ROCs for different tagger and efficiencies from validation workflow
python scripts/validation_plot.py -i $INPUT_COFFEA -v $VERSION
{
    "WJets": ["WJetsToLNu_TuneCP5_13p6TeV-madgraphMLM-pythia8"],
    "VV": ["WW_TuneCP5_13p6TeV-pythia8", "WZ_TuneCP5_13p6TeV-pythia8", "ZZ_TuneCP5_13p6TeV-pythia8"],
    "TT": ["TTTo2J1L1Nu_CP5_13p6TeV_powheg-pythia8", "TTTo2L2Nu_CP5_13p6TeV_powheg-pythia8"],
    "ST": ["TBbarQ_t-channel_4FS_CP5_13p6TeV_powheg-madspin-pythia8",        "TbarWplus_DR_AtLeastOneLepton_CP5_13p6TeV_powheg-pythia8", "TbarBQ_t-channel_4FS_CP5_13p6TeV_powheg-madspin-pythia8", "TWminus_DR_AtLeastOneLepton_CP5_13p6TeV_powheg-pythia8"],
    "data": ["Muon_Run2022C-PromptReco-v1", "SingleMuon_Run2022C-PromptReco-v1", "Muon_Run2022D-PromptReco-v1", "Muon_Run2022D-PromptReco-v2"]
}
correlation_plots.py: get linear correlation from arrays
You can perform a study of linear correlations of b-tagging input variables. Additionally, soft muon variables may be added into the study by requesting --SMu argument. If you wan to limit the outputs only to DeepFlavB, PNetB and RobustParTAK4B, you can use the --limit_outputs option. If you want to use only the set of variables used for tagger training, not just all the input variables, then use the option --limit_inputs. To limit number of files read, make use of option --max_files. In case your study requires splitting samples by flavour, use --flavour_split. --split_region_b performs a sample splitting based on the DeepFlavB >/< 0.5.
Caution
For Data/MC comparison purpose pay attention - change ranking factors (xs/sumw) in L420!
python correlation_plots.py $input_folder [--max_files $nmax_files --SMu --limit_inputs --limit_outputs --specify_MC --flavour_split --split_region_b]